|
|
Research Theme
|
Research Target
In this project, we will study on Visual Analytics Tools for Network Data to detect illigal accesses by interactively analyzing IP packets data.
Research Contents
We will develop Interactive 3D Visualization Tools based on 2D View by extending the concept of TimeTunnel, which is a visual analytics tool for time-varying multi-dimensional data developed using IntelligentBox.
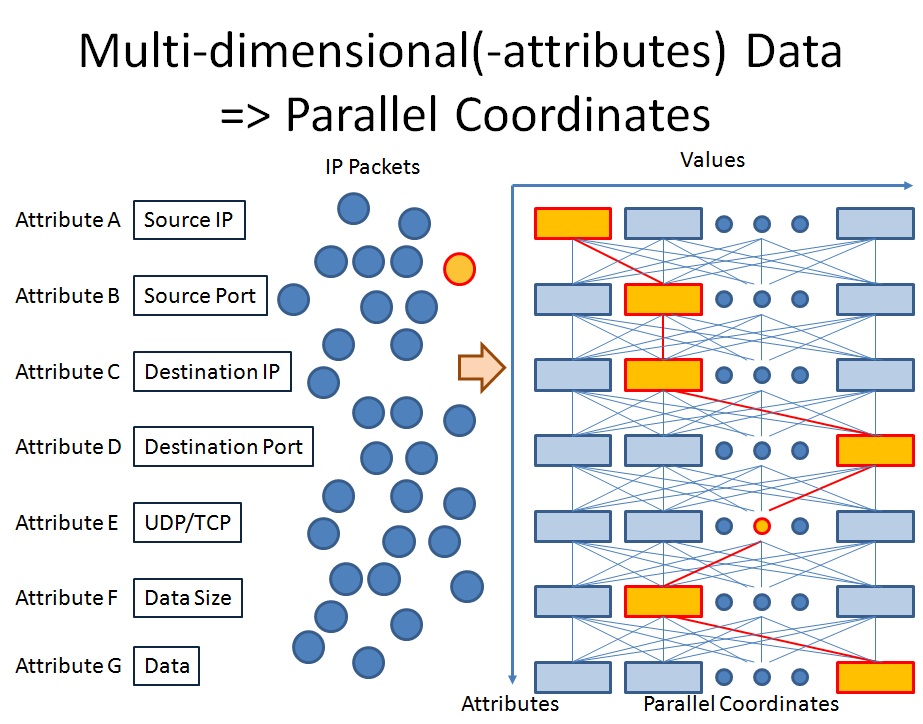
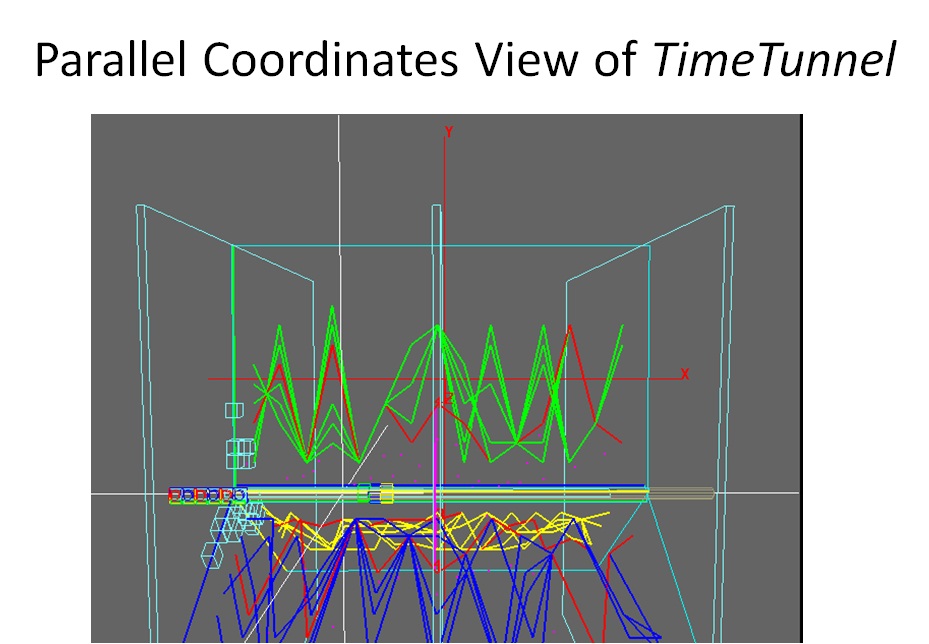
As shown in the upper figure, IP packets data can be visualized in Parallel Coordinates View without any information loss. The lower figure shows a visualization example by Parallel Coordinates View of TimeTunnel.
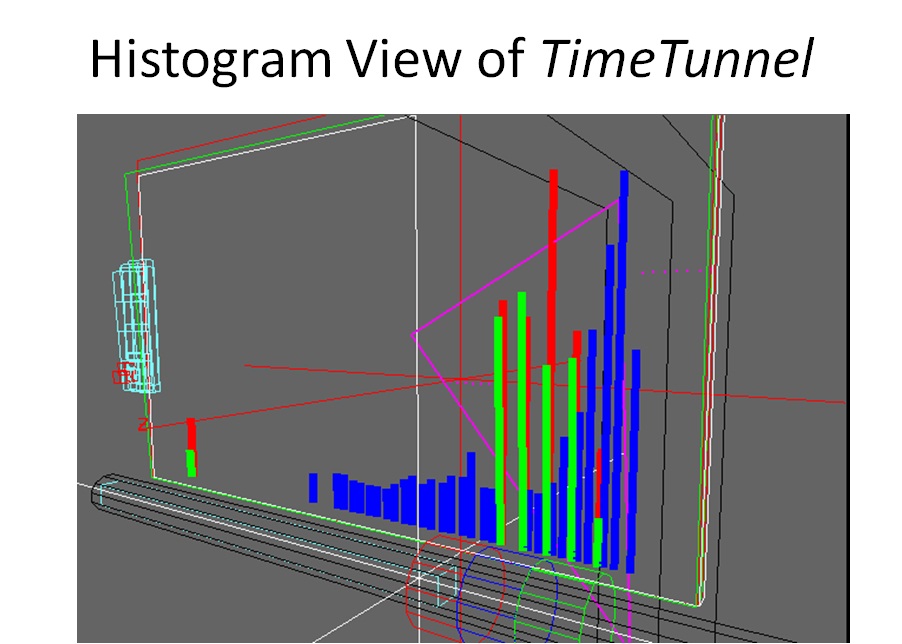
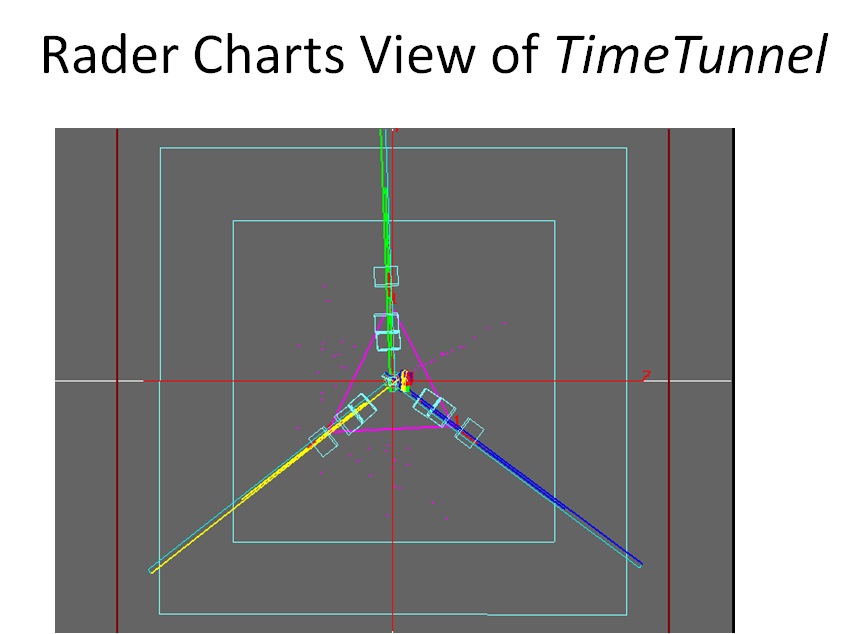
The upper and lower figures are visualization examples by Histogram view of TimeTunnel and a visualization example by Rader Charts View of TimeTunnel, respectively.
In this research project, we will develop interactive 3D visualization tool by using any 2D view (Parallel Coordinates, Histogram, Rader Charts) and additional one dimension of time value in 3D space that enables us to dynamically analyze IP packets data.
Furthermore, we will consider conbinatorial use of some visualization tools, like Treemap, Cube of Nicter, with the above visualization tools in order to make it possible to analyze IP packets data more effectively.
Relational academic conferences, workshops, symposiums
SCIS
IBIS Workshop
IBISML
ISIT
SITA
|
|
