Visualization Tools for Network Security
Framework of Interactive 3D Visualization Tool based on 2D View for analyzing time-varying multi-dimensional data
In this research project, we will develop Interactive 3D Visualization tool that helps us to interactively analyze time-varying multi-dimensional data, by extending the concept of TimeTunnel. Especially, we focus on IP packets data.
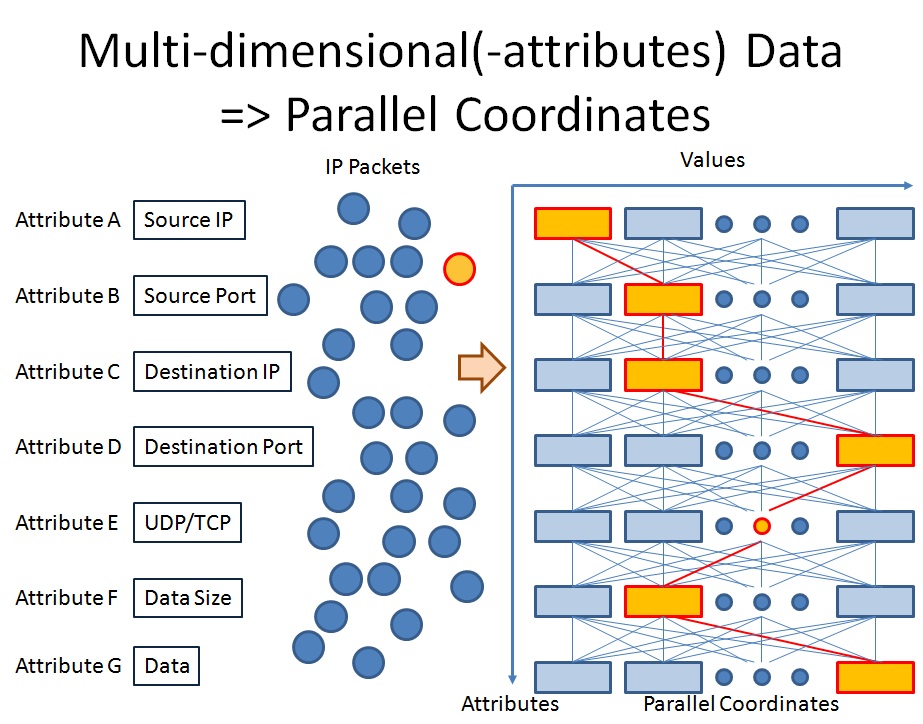
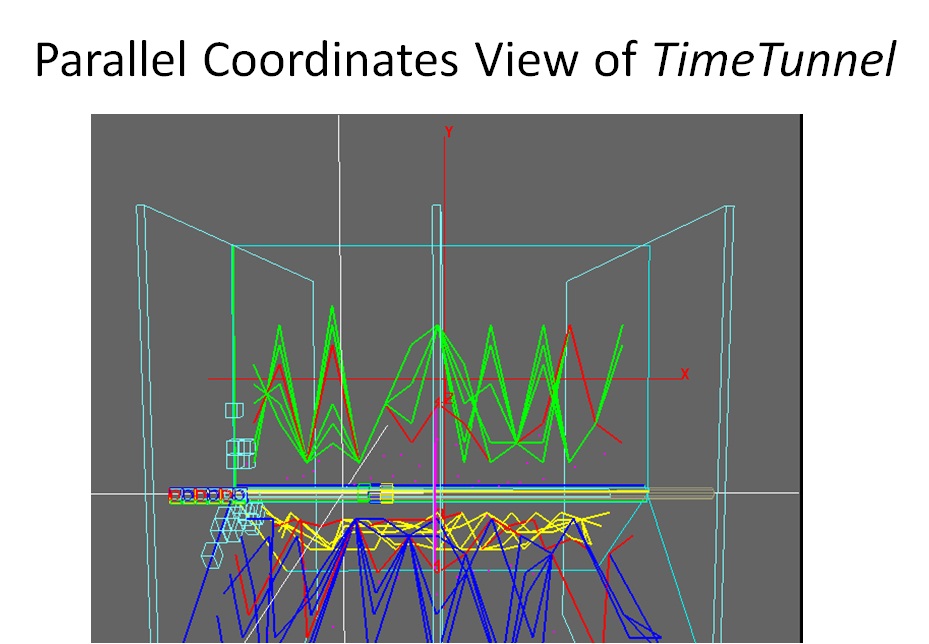
As shown in the left figure, IP packets data can be visualized in Parallel Coordinates View without any information loss. The right figure shows a visualization example by Parallel Coordinates View of TimeTunnel.
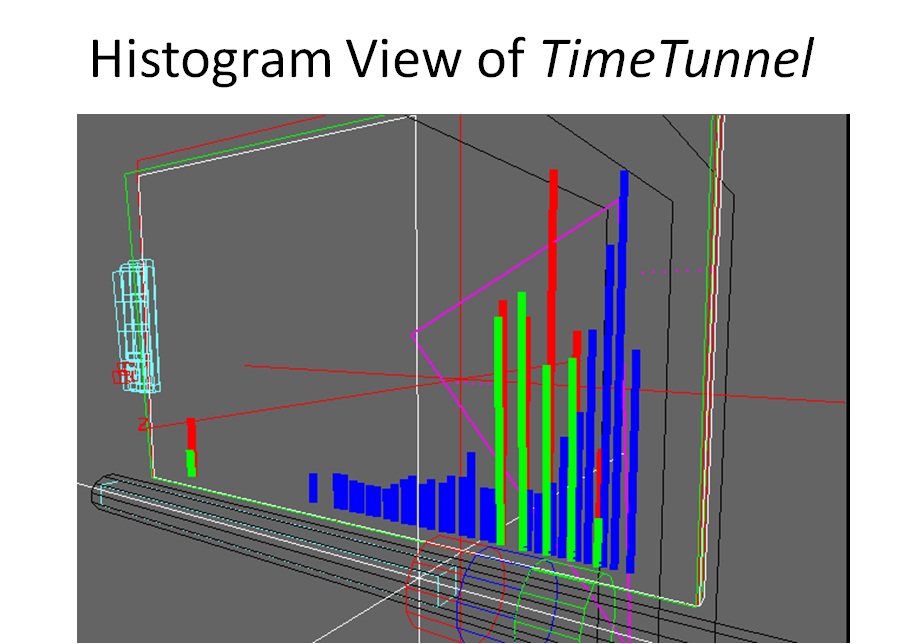
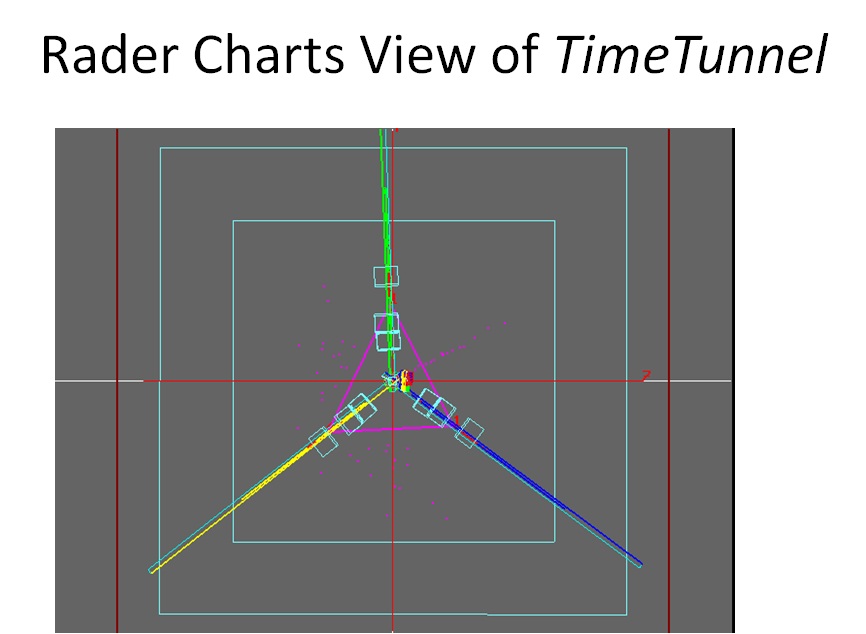
The left and right figures are a visualization example by Histogram view of TimeTunnel and a visualization example by Rader Charts View of TimeTunnel, respectively.
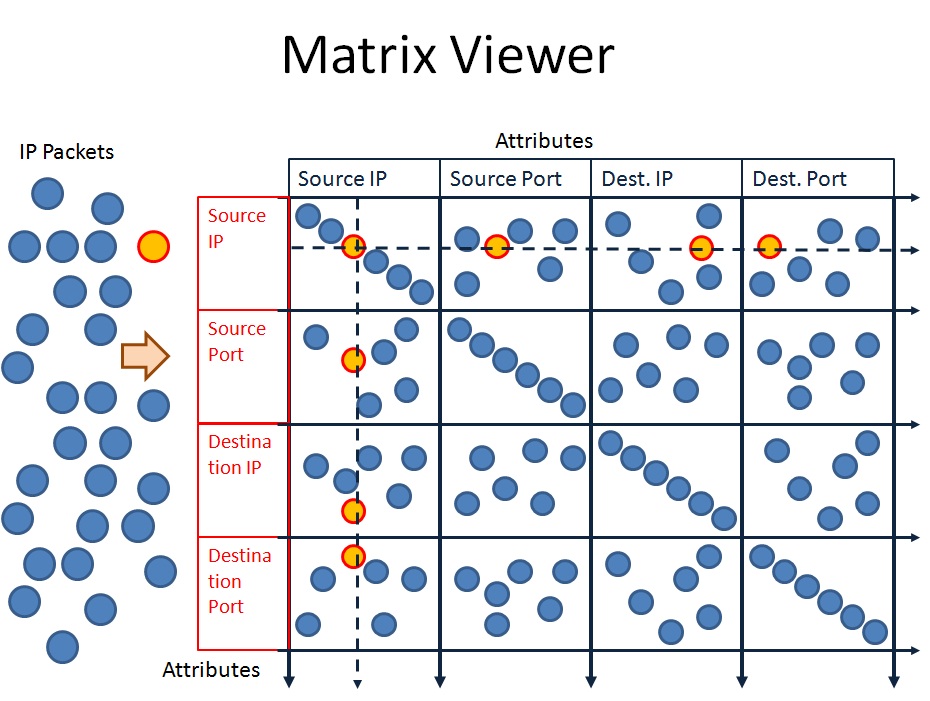
As shown in the above figure, Matrix View visualizes all relationships between any two attributes of data for the whole attributes.
In this research project, we will develop interactive 3D visualization tool by using any 2D view (Parallel Coordinates, Histogram, Rader Charts, Matrix view) and additional one dimension of time value in 3D space that enables us to dynamically analyze IP packets data.
Furthermore, we will develop several program libraries for visualizing IP packets data using SOM(Self-Organizing Map), K-Means Clustering, etc. integrated with the above visualization tools.